As-Constructed Drawing Project Completion with Lunr
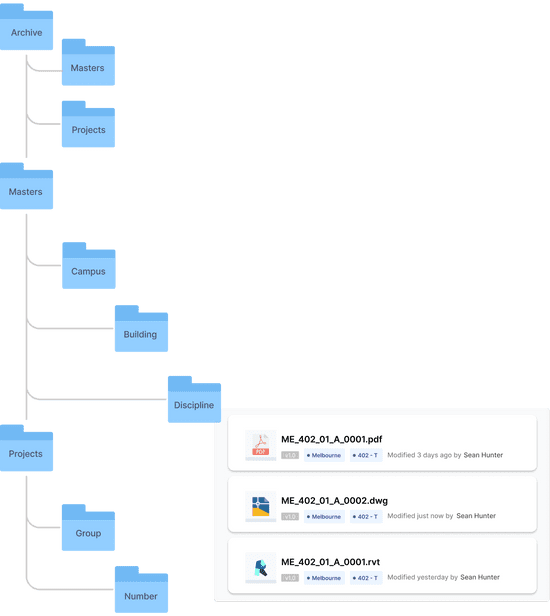
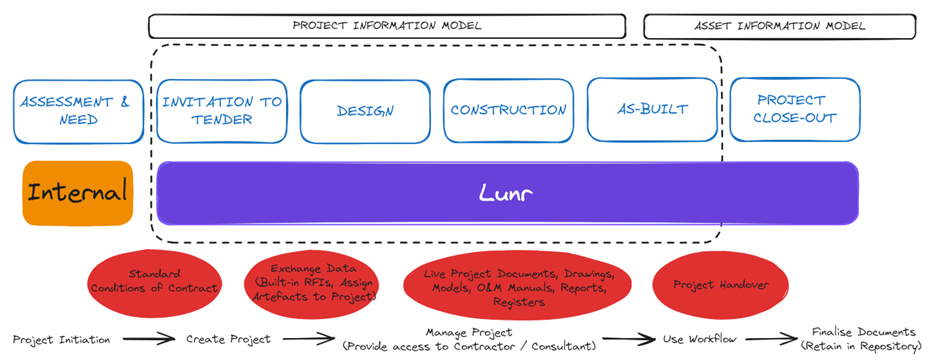
A Lunr workspace is thoughtfully divided into two areas: the document repository and projects. The document repository, a folder-based area, is designed for efficient storage of engineering documentation. Projects, on the other hand, provide a streamlined way to manage the delivery of as-constructed drawings via Signal, ensuring you stay organized and on top of your tasks.
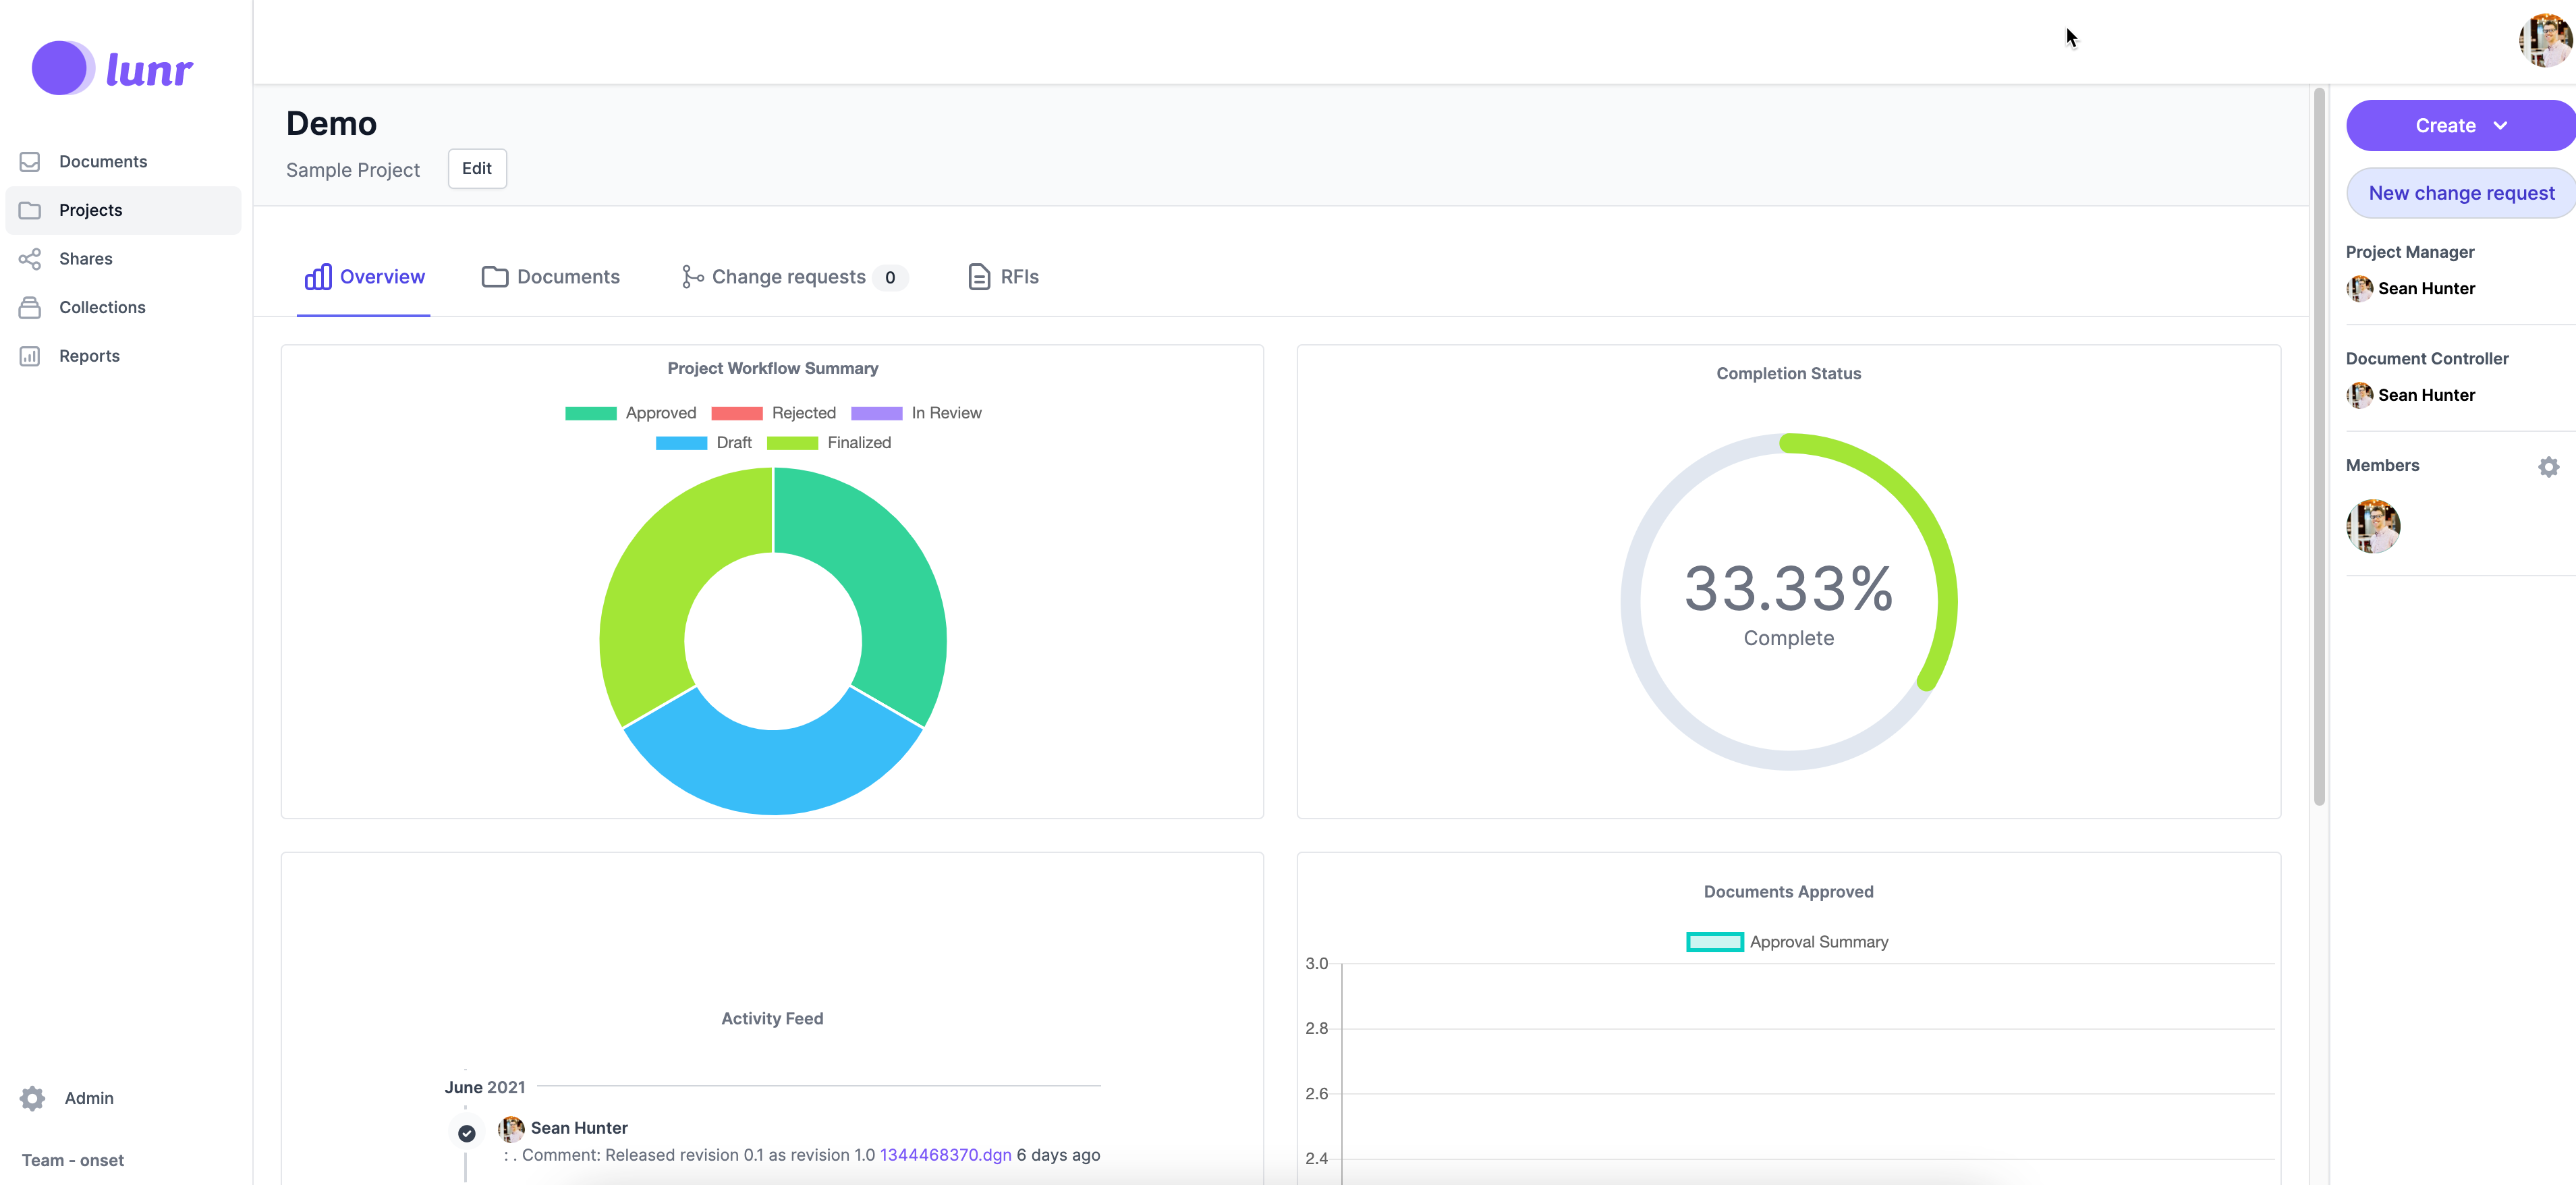
When you open a project in Lunr, the first thing that greets you is the project completion overview dashboard. This comprehensive tool provides a birds-eye view of your project's progress, giving you a clear understanding of how close you are to completion. The dashboard takes into account various factors to provide a realistic indication of your project's status, empowering you to make informed decisions.
Estimated as-constructed drawings: One of the key features of Lunr is its flexibility. When creating a project, you have the option to indicate the estimated number of drawings you expect to receive. This feature is particularly useful in cases where you can't pre-allocate your as-constructed drawing placeholders ahead of time, allowing you to adapt to changing project requirements.
Document numbers allocated: If you're allocating document numbers to a project ahead of time, this metric captures the placeholders set aside that are expected to come back in as a part of the as-constructed handover process. Document numbers refer to unique identifiers assigned to each document in the system.
Existing documents under workflow: Any documents assigned from the document repository to a project count towards this metric. These documents are expected to complete workflow when they're returned either un-revised or revised.
Completion Status
Using the metrics mentioned above, Lunr compiles a completion report. This report is a valuable tool that gives you a clear picture of how far you've come in completing your project, helping you plan your next steps effectively.
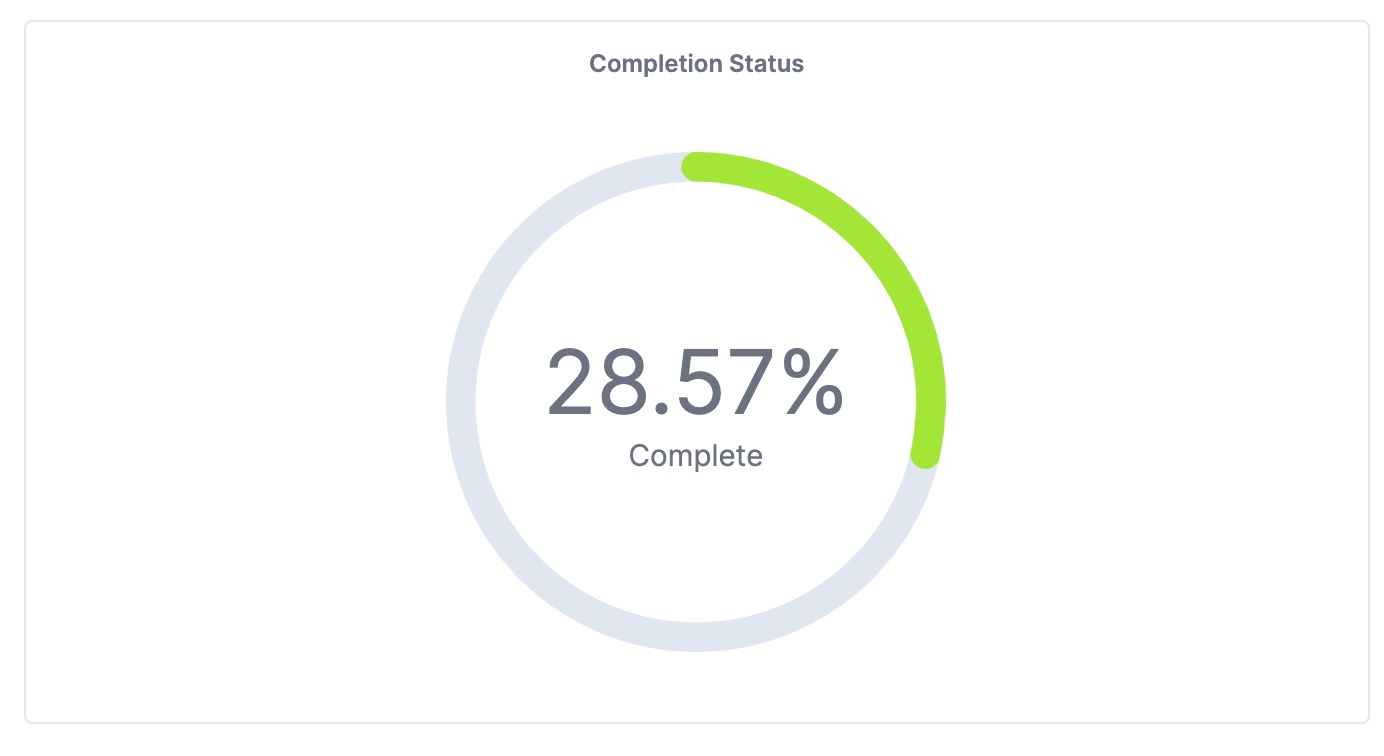 As an asset owner, this can be used as a guide for when to release any retention funds to the project vendors. From the contractor side, it provides a way to gauge when you're ready to finalise the project handover with clients.
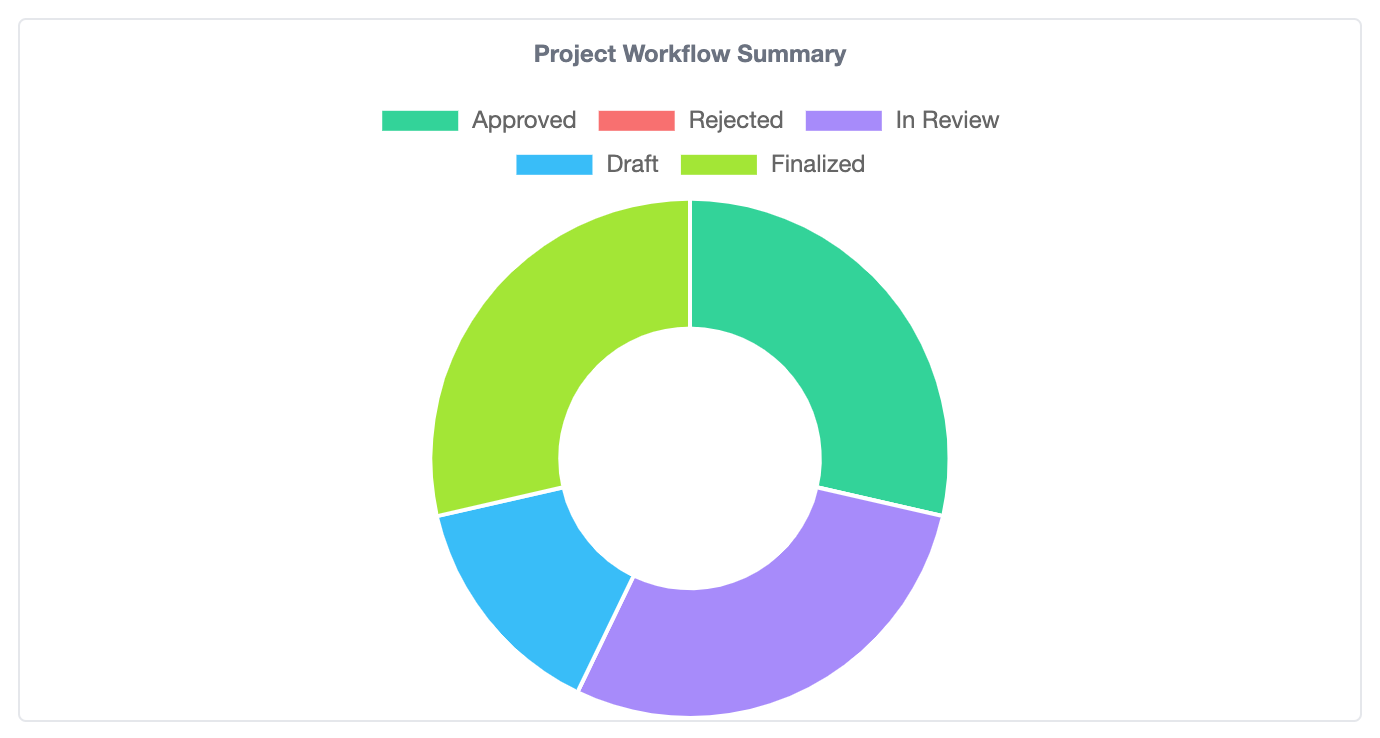
Project Workflow Summary
This chart provides an overview of the workflow status distribution of your project documentation. It can be useful for identifying project bottlenecks. For example, if you can see that 50% of the project documents are in review, it could mean that the document control department needs more resourcing to keep up with the project handover workload.
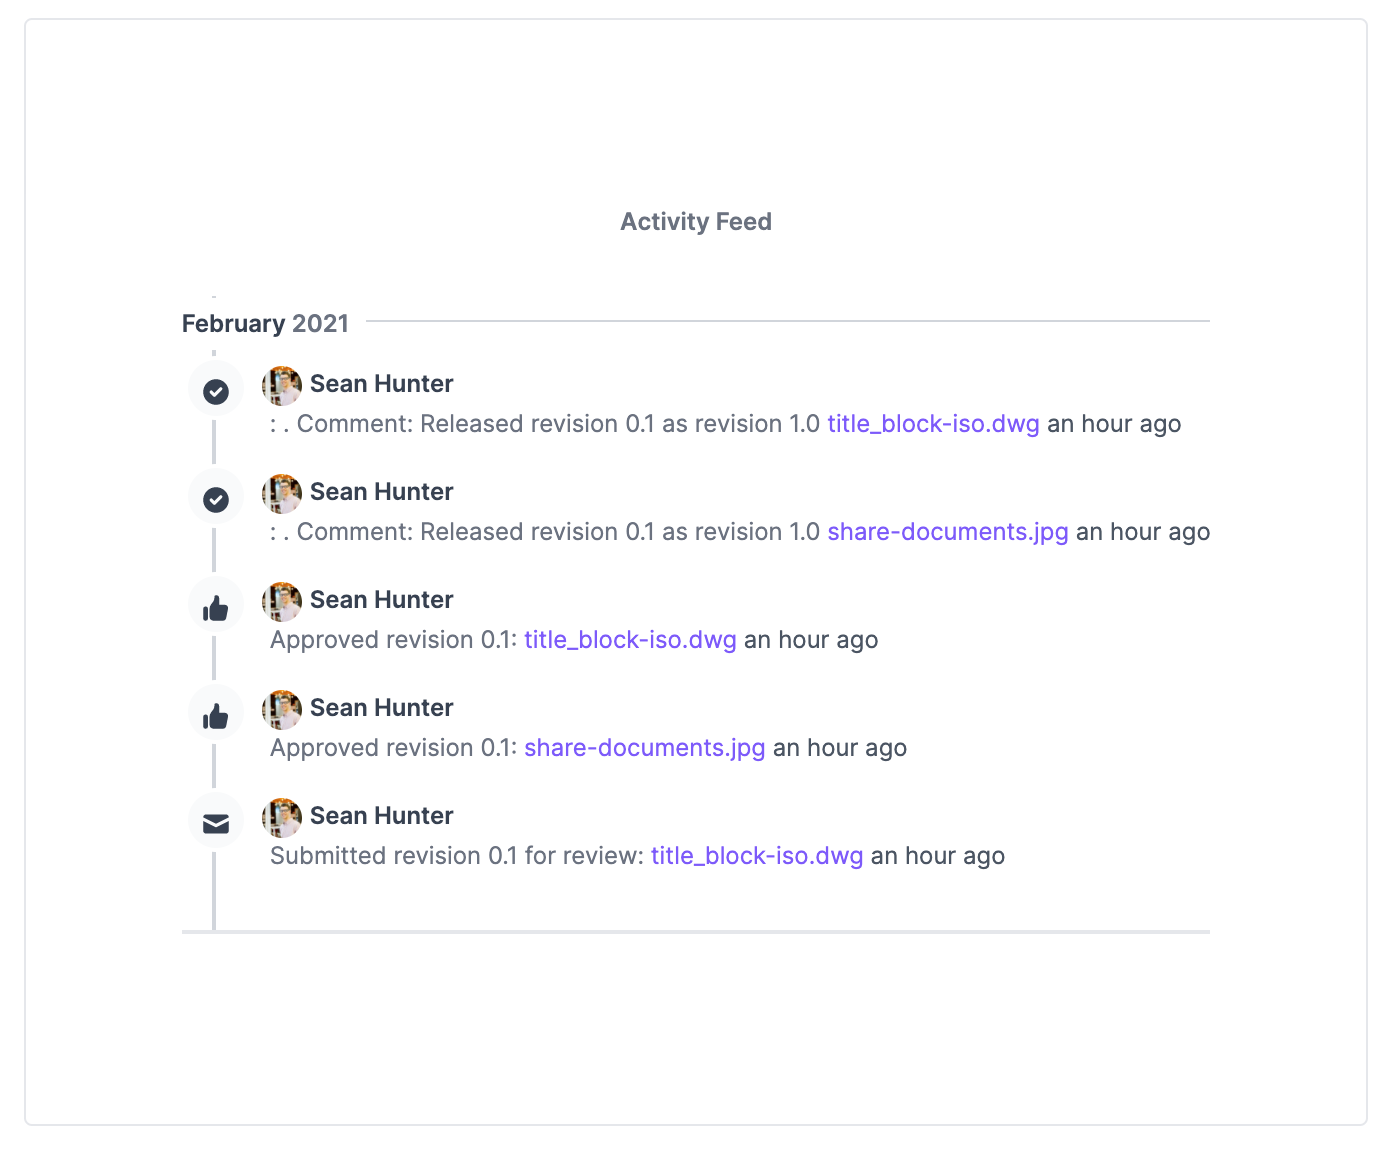
 Project Activity
The project activity feed lets you see who has been active on a project and what they've been up to. You can jump to any linked document from the feed to participate in the document review process.
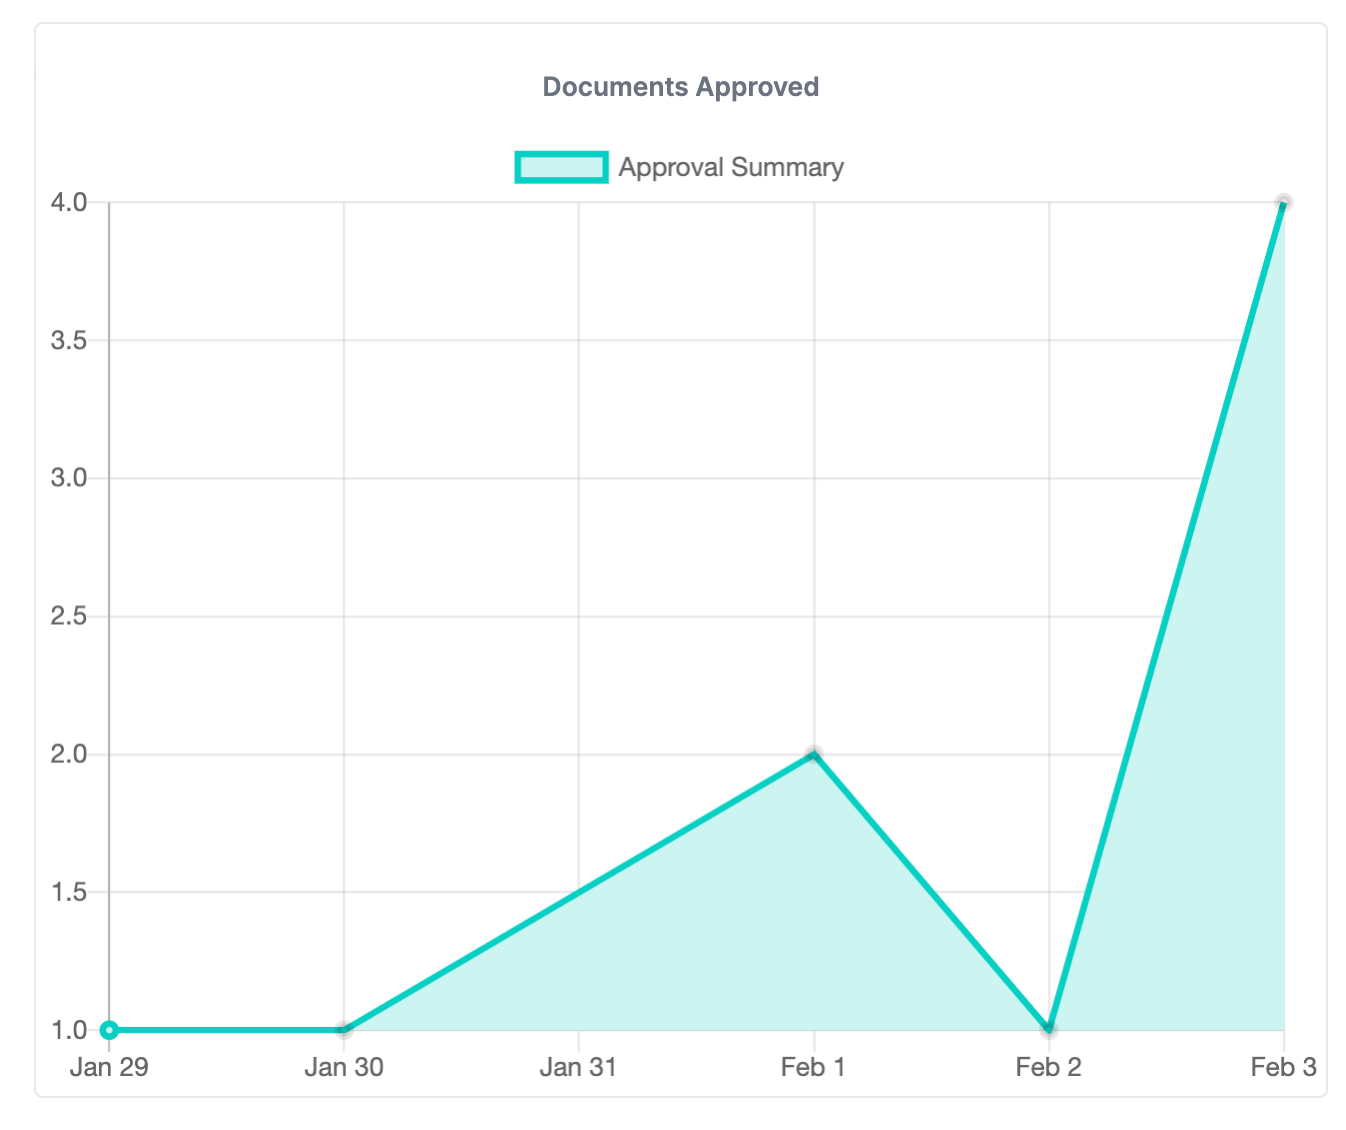
 Documents Approved
The documents approved chart allows you to see how the document handover within a project is trending. If you see a sharp drop-off in documents approved, it could just be a holiday weekend, but it may also be an advanced warning of upcoming delivery delays.
 Power BI
The baseline reports included in the project overview are a great starting point and can give you insights into how you're tracking with as-constructed project completion. For larger and more complex projects with many documents and stakeholders, it's often helpful to take things a step further to determine where your project bottlenecks are and how you can streamline them. The best way to address these situations is to use the Signal REST API to query project and document data and feed this into your Azure PowerBI environment for further reporting. While this is more work to set up, it can give you outstanding insights into your project delivery, sparking optimism and motivation about the project's progress.
